When we launched Amazon CloudWatch back in 2009 (New Features for Amazon EC2: Elastic Load Balancing, Auto Scaling, and Amazon CloudWatch), it tracked performance metrics (CPU load, Disk I/O, and network I/O) for EC2 instances, rolled them up at one-minute intervals, and stored them for two weeks. At that time it was used to monitor instance health and to drive Auto Scaling. Today, CloudWatch is a far more comprehensive and sophisticated service. Some of the most recent additions include metrics with 1-minute granularity for all EBS volume types, CloudWatch Lambda Insights, and the Metrics Explorer.
AWS Partners have used the CloudWatch metrics to create all sorts of monitoring, alerting, and cost management tools. In order to access the metrics the partners created polling fleets that called the ListMetrics and GetMetricDatafunctions for each of their customers.
These fleets must scale in proportion to the number of AWS resources created by each of the partners’ customers and the number of CloudWatch metrics that are retrieved for each resource. This polling is simply undifferentiated heavy lifting that each partner must do. It adds no value, and takes precious time that could be better invested in other ways.
New Metric Streams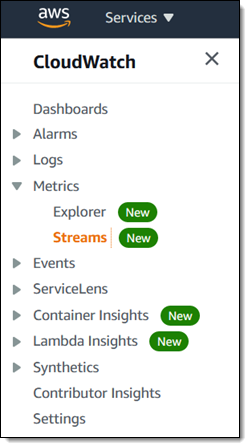 In order to make it easier for AWS Partners and others to gain access to CloudWatch metrics faster and at scale, we are launching CloudWatch Metric Streams. Instead of polling (which can result in 5 to 10 minutes of latency), metrics are delivered to a Kinesis Data Firehose stream. This is highly scalable and far more efficient, and supports two important use cases:
Partner Services – You can stream metrics to a Kinesis Data Firehose that writes data to an endpoint owned by an AWS Partner. This allows partners to scale down their polling fleets substantially, and lets them build tools that can respond more quickly when key cost or performance metrics change in unexpected ways.
Data Lake – You can stream metrics to a Kinesis Data Firehose of your own. From there you can apply any desired data transformations, and then push the metrics into Amazon Simple Storage Service (S3) or Amazon Redshift. You then have the full array of AWS analytics tools at your disposal: S3 Select, Amazon SageMaker, Amazon EMR, Amazon Athena, Amazon Kinesis Data Analytics, and more. Our customers do this to combine billing and performance data in order to measure & improve cost optimization, resource performance, and resource utilization.
CloudWatch Metric Streams are fully managed and very easy to set up. Streams can scale to handle any volume of metrics, with delivery to the destination within two or three minutes. You can choose to send all available metrics to each stream that you create, or you can opt-in to any of the available AWS (EC2, S3, and so forth) or custom namespaces.
Once a stream has been set up, metrics start to flow within a minute or two. The flow can be stopped and restarted later if necessary, which can be handy for testing and debugging. When you set up a stream you choose between the binary Open Telemetry 0.7 format, and the human-readable JSON format.
Each Metric Stream resides in a particular AWS region and delivers metrics to a single destination. If you want to deliver metrics to multiple partners, you will need to create a Metric Stream for each one. If you are creating a centralized data lake that spans multiple AWS accounts and/or regions, you will need to set up some IAM roles (see Controlling Access with Amazon Kinesis Data Firehose for more information).
Creating a Metric Stream
Let’s take a look at two ways to use a Metric Stream. First, I will use the Quick S3 setup option to send data to a Kinesis Data Firehose and from there to S3. Second, I will use a Firehose that writes to an endpoint at AWS Partner New Relic.
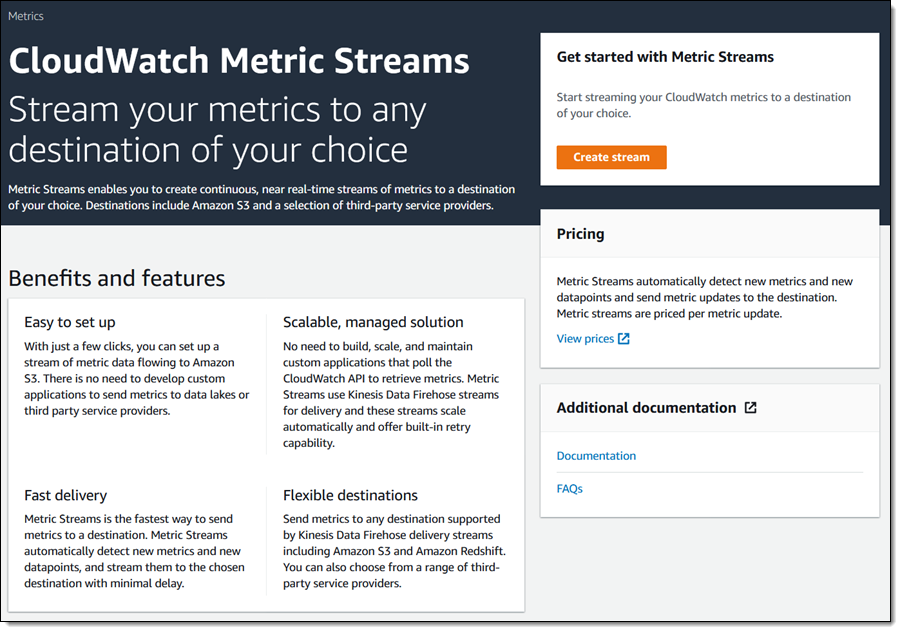
I open the CloudWatch Console, select the desired region, and click Streams in the left-side navigation. I review the page, and click Create stream to proceed:
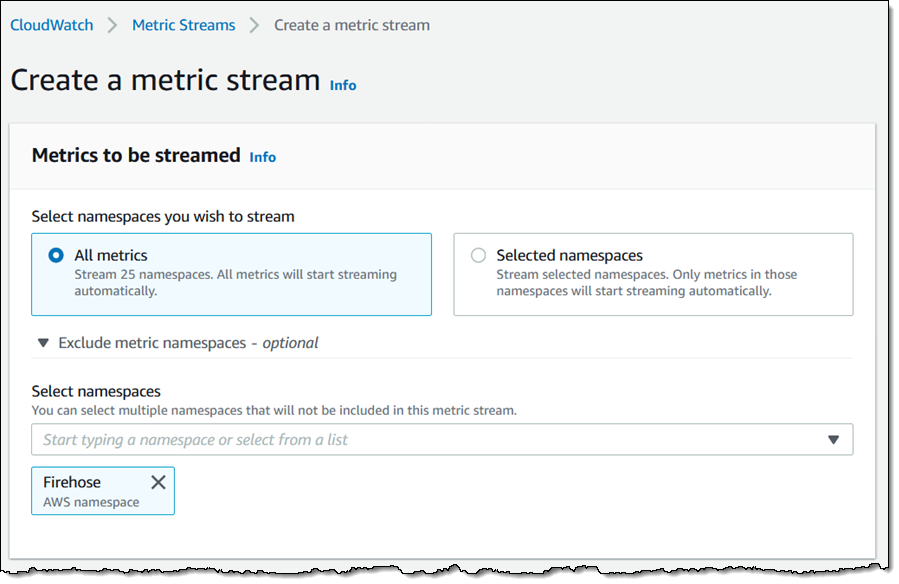
I choose the metrics to stream. I can select All metrics and then exclude those that I don’t need, or I can click Selected namespaces and include those that I need. I’ll go for All, but exclude Firehose:
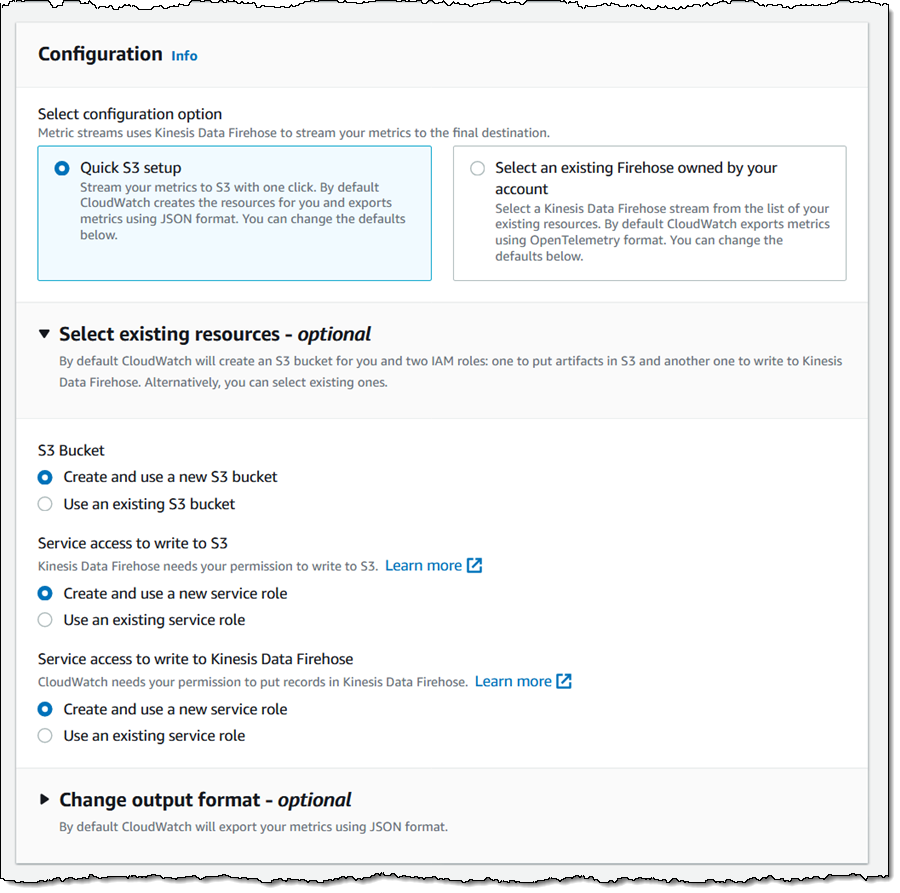
I select Quick S3 setup, and leave the other configuration settings in this section unchanged (I expanded it so that you could see all of the options that are available to you):
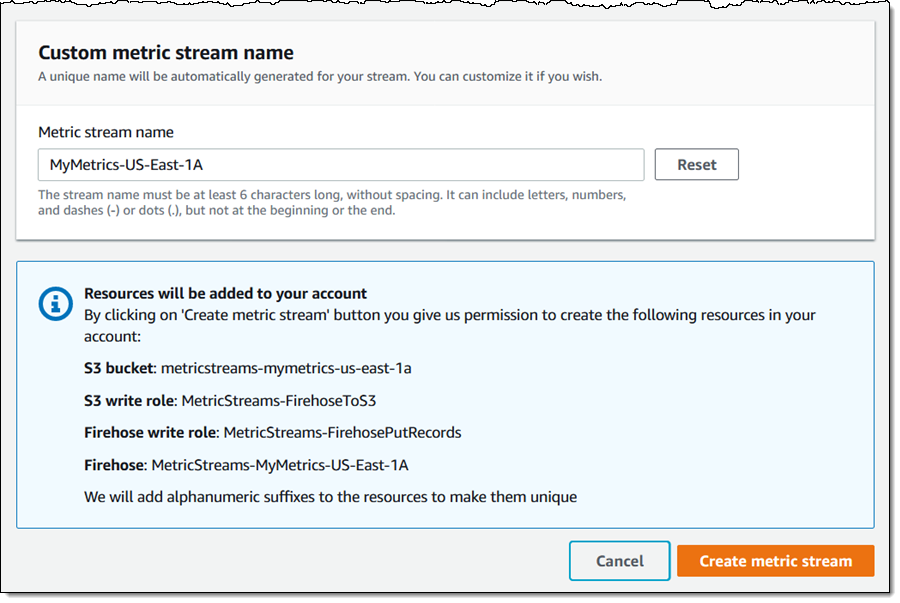
Then I enter a name (MyMetrics-US-East-1A) for my stream, confirm that I understand the resources that will be created, and click Create metric stream:
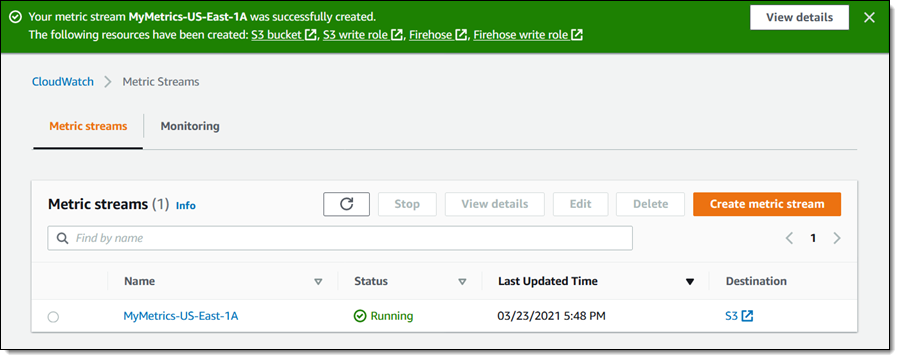
My stream is created and active within seconds:
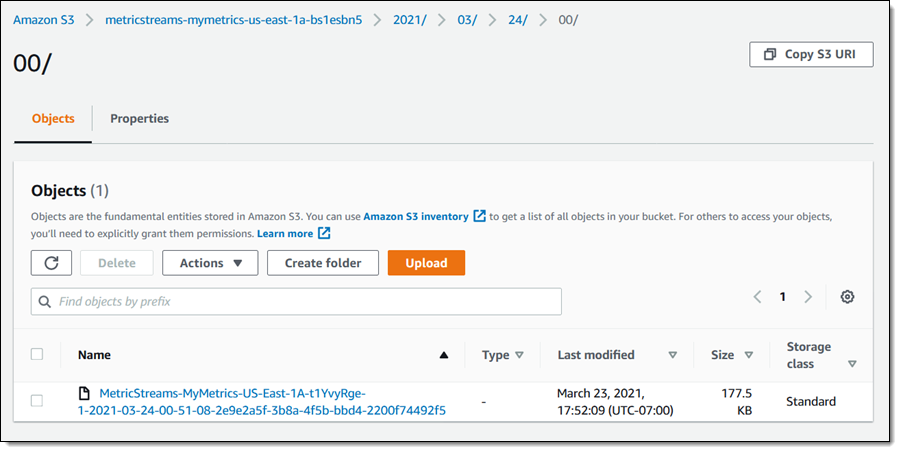
Objects begin to appear in the S3 bucket within a minute or two:
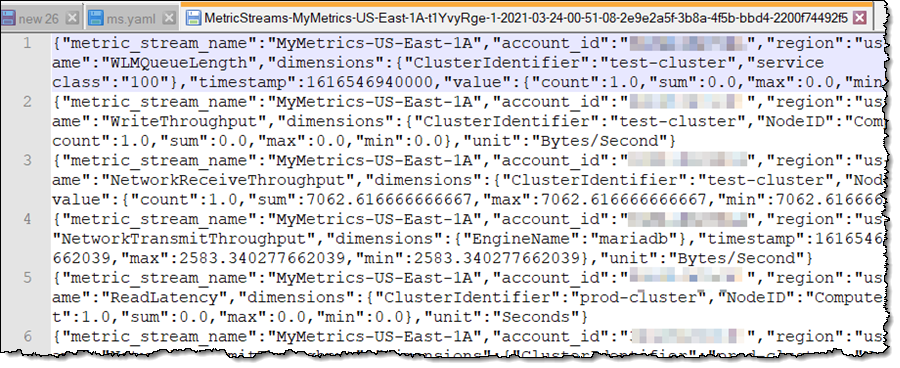
I can analyze my metrics using any of the tools that I listed above, or I can simply look at the raw data:
Each Metric Stream generates its own set of CloudWatch metrics:

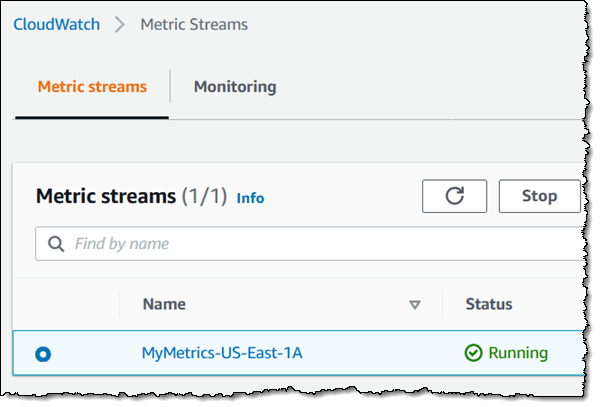
I can stop a running stream:
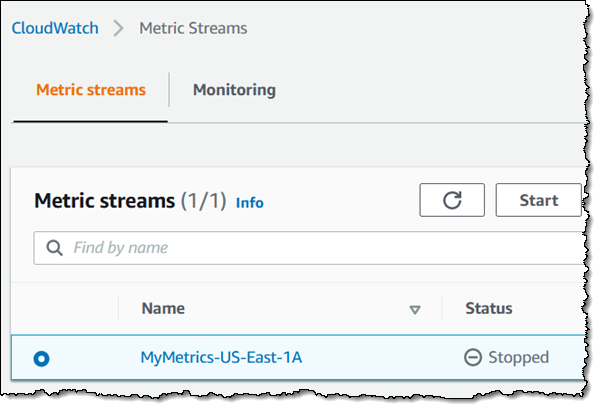
And then start it:
I can also create a Metric Stream using a CloudFormation template. Here’s an excerpt:
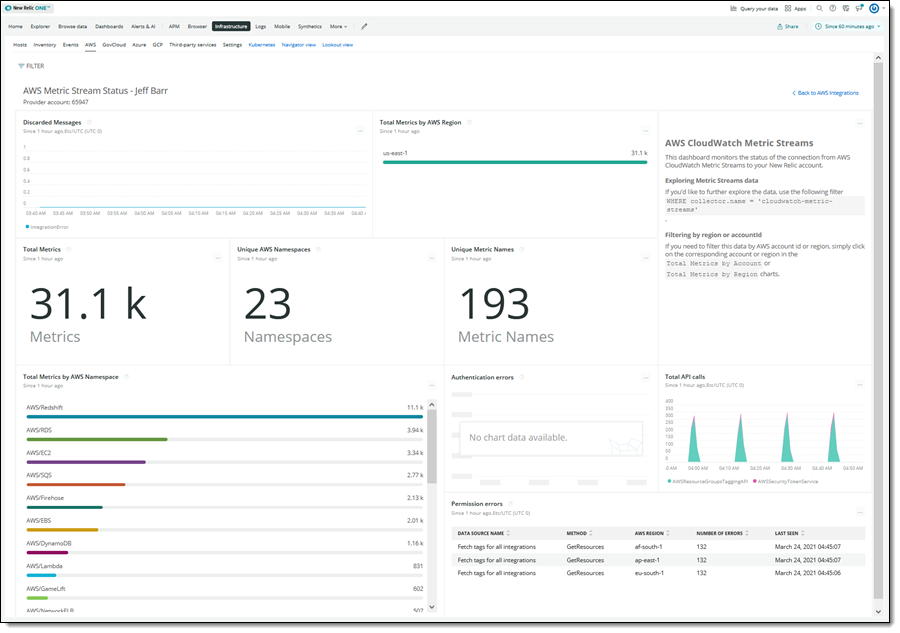
Now let’s take a look at the Partner-style use case! The team at New Relic set me up with a CloudFormation template that created the necessary IAM roles and the Metric Stream. I simply entered my API key and an S3 bucket name and the template did all of the heavy lifting. Here’s what I saw:
Things to Know
And that’s about it! Here are a couple of things to keep in mind:
Regions – Metric Streams are now available in all commercial AWS Regions, excluding the AWS China (Beijing) Region and the AWS China (Ningxia) Region. As noted earlier, you will need to create a Metric Stream in each desired account and region (this is a great use case for CloudFormation Stacksets).
Pricing – You pay $0.003 for every 1000 metric updates, and for any charges associated with the Kinesis Data Firehose. To learn more, check out the pricing page.
Metrics – CloudWatch Metric Streams is compatible with all CloudWatch metrics, but does not send metrics that have a timestamp that is more than two hours old. This includes S3 daily storage metrics and some of the billing metrics.
Partner Services
We designed this feature with the goal of making it easier & more efficient for AWS Partners including Datadog, Dynatrace, New Relic, Splunk, and Sumo Logic to get access to metrics so that the partners can build even better tools. We’ve been working with these partners to help them get started with CloudWatch Metric Streams. Here are some of the blog posts that they wrote in order to share their experiences. (I am updating this article with links as they are published.)
Now Available
CloudWatch Metric Streams is available now and you can use it to stream metrics to a Kinesis Data Firehose of your own or an AWS Partners. For more information, check out the documentation and send feedback to the AWS forum for Amazon CloudWatch.
— Jeff;

