In December, we introduced the preview of Amazon Managed Grafana, a fully managed service developed in collaboration with Grafana Labs that makes it easy to use the open-source and the enterprise versions of Grafana to visualize and analyze your data from multiple sources. With Amazon Managed Grafana, you can analyze your metrics, logs, and traces without having to provision servers, or configure and update software.
During the preview, Amazon Managed Grafana was updated with new capabilities. Today, I am happy to announce that Amazon Managed Grafana is now generally available with additional new features:
- Grafana has been upgraded to version 8 and offers new data sources, visualizations, and features, including library panels that you can build once and re-use on multiple dashboards, a Prometheus metrics browser to quickly find and query metrics, and new state timeline and status history visualizations.
- To centralize the querying of additional data sources within an Amazon Managed Grafana workspace, you can now query data using the JSON data source plugin. You can now also query Redis, SAP HANA, Salesforce, ServiceNow, Atlassian Jira, and many more data sources.
- You can use Grafana API keys to publish your own dashboards or give programmatic access to your Grafana workspace. For example, this is a Terraform recipe that you can use to add data sources and dashboards.
- You can enable single sign-on to your Amazon Managed Grafana workspaces using Security Assertion Markup Language 2.0 (SAML 2.0). We have worked with these identity providers (IdP) to have them integrated at launch: CyberArk, Okta, OneLogin, Ping Identity, and Azure Active Directory.
- All calls from the Amazon Managed Grafana console and code calls to Amazon Managed Grafana API operations are captured by AWS CloudTrail. In this way, you can have a record of actions taken in Amazon Managed Grafana by a user, role, or AWS service. Additionally, you can now audit mutating changes that occur in your Amazon Managed Grafana workspace, such as when a dashboard is deleted or data source permissions are changed.
- The service is available in ten AWS Regions (full list at the end of the post).
Let’s do a quick walkthrough to see how this works in practice.
Using Amazon Managed Grafana
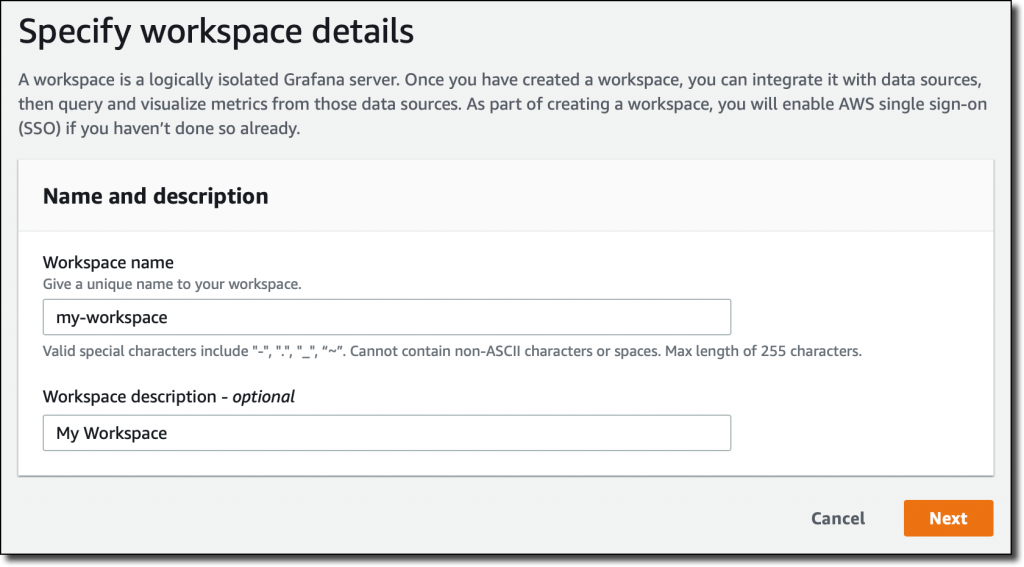
In the Amazon Managed Grafana console, I choose Create workspace. A workspace is a logically isolated, highly available Grafana server. I enter a name and a description for the workspace, and then choose Next.
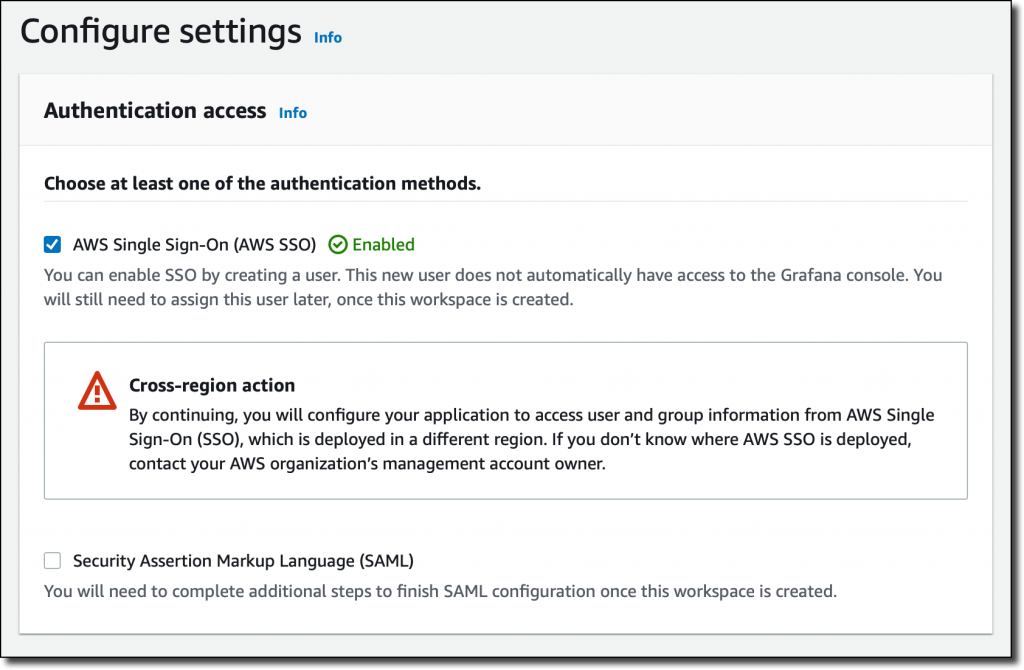
I can use AWS Single Sign-On (AWS SSO) or an external identity provider via SAML to authenticate the users of my workspace. For simplicity, I select AWS SSO. Later in the post, I’ll show how SAML authentication works. If this is your first time using AWS SSO, you can see the prerequisites (such as having AWS Organizations set up) in the documentation.
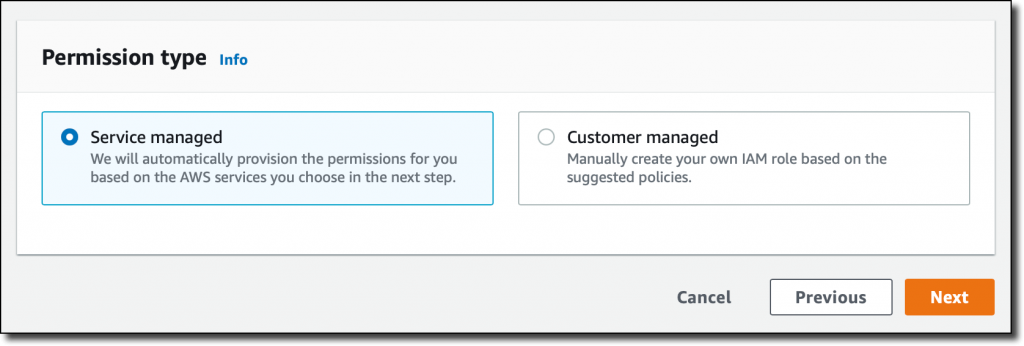
Then, I choose the Service managed permission type. In this way, Amazon Managed Grafana will automatically provision the necessary IAM permissions to access the AWS Services that I select in the next step.
In Service managed permission settings, I choose to monitor resources in my current AWS account. If you use AWS Organizations to centrally manage your AWS environment, you can use Grafana to monitor resources in your organizational units (OUs).
I can optionally select the AWS data sources that I am planning to use. This configuration creates an AWS Identity and Access Management (IAM) role that enables Amazon Managed Grafana to access those resources in my account. Later, in the Grafana console, I can set up the selected services as data sources. For now, I select Amazon CloudWatch so that I can quickly visualize CloudWatch metrics in my Grafana dashboards.
Here I also configure permissions to use Amazon Managed Service for Prometheus (AMP) as a data source and have a fully managed monitoring solution for my applications. For example, I can collect Prometheus metrics from Amazon Elastic Kubernetes Service (EKS) and Amazon Elastic Container Service (Amazon ECS) environments, using AWS Distro for OpenTelemetry or Prometheus servers as collection agents.
In this step I also select Amazon Simple Notification Service (SNS) as a notification channel. Similar to the data sources before, this option gives Amazon Managed Grafana access to SNS but does not set up the notification channel. I can do that later in the Grafana console. Specifically, this setting adds SNS publish permissions to topics that start with grafana to the IAM role created by the Amazon Managed Grafana console. If you prefer to have tighter control on permissions for SNS or any data source, you can edit the role in the IAM console or use customer-managed permissions for your workspace.
Finally, I review all the options and create the workspace.
After a few minutes, the workspace is ready, and I find the workspace URL that I can use to access the Grafana console.
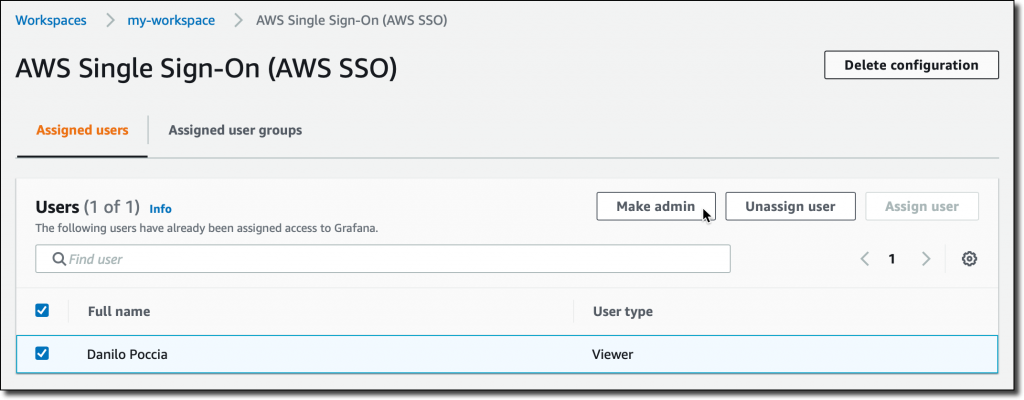
I need to assign at least one user or group to the Grafana workspace to be able to access the workspace URL. I choose Assign new user or group and then select one of my AWS SSO users.
By default, the user is assigned a Viewer user type and has view-only access to the workspace. To give this user permissions to create and manage dashboards and alerts, I select the user and then choose Make admin.
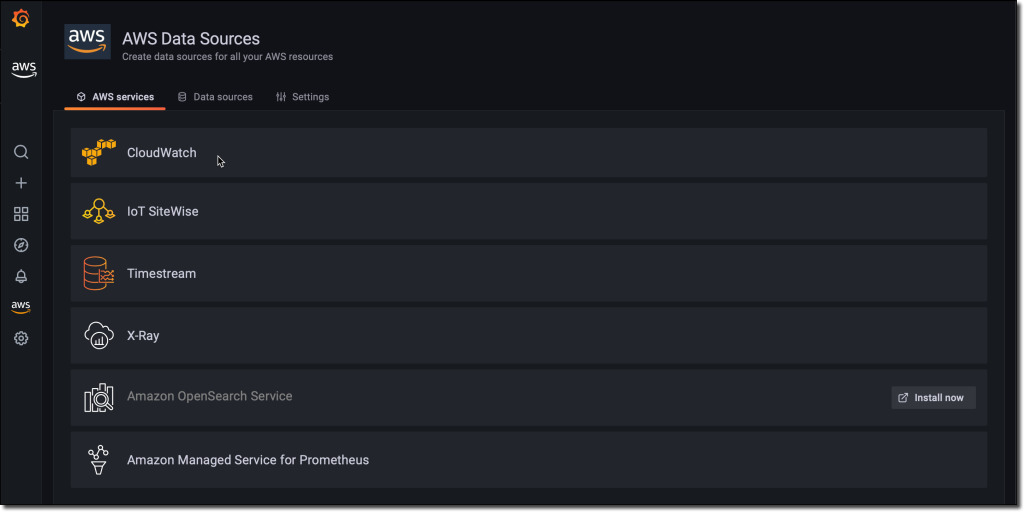
Back to the workspace summary, I follow the workspace URL and sign in using my AWS SSO user credentials. I am now using the open-source version of Grafana. If you are a Grafana user, everything is familiar. For my first configurations, I will focus on AWS data sources so I choose the AWS logo on the left vertical bar.
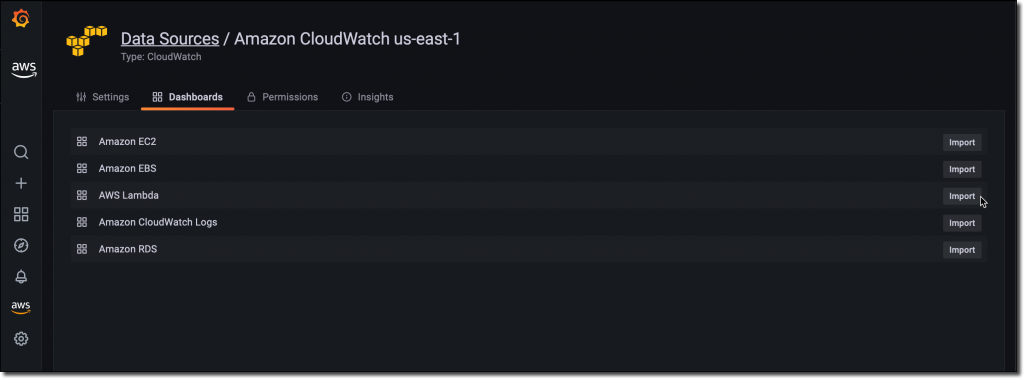
Here, I choose CloudWatch. Permissions are already set because I selected CloudWatch in the service-managed permission settings earlier. I select the default AWS Region and add the data source. I choose the CloudWatch data source and on the Dashboards tab, I find a few dashboards for AWS services such as Amazon Elastic Compute Cloud (Amazon EC2), Amazon Elastic Block Store (EBS), AWS Lambda, Amazon Relational Database Service (RDS), and CloudWatch Logs.
I import the AWS Lambda dashboard. I can now use Grafana to monitor invocations, errors, and throttles for Lambda functions in my account. I’ll save you the screenshot because I don’t have any interesting data in this Region.
Using SAML Authentication
If I don’t have AWS SSO enabled, I can authenticate users to the Amazon Managed Grafana workspace using an external identity provider (IdP) by selecting the SAML authentication option when I create the workspace. For existing workspaces, I can choose Setup SAML configuration in the workspace summary.
First, I have to provide the workspace ID and URL information to my IdP in order to generate IdP metadata for configuring this workspace.
After my IdP is configured, I import the IdP metadata by specifying a URL or copying and pasting to the editor.
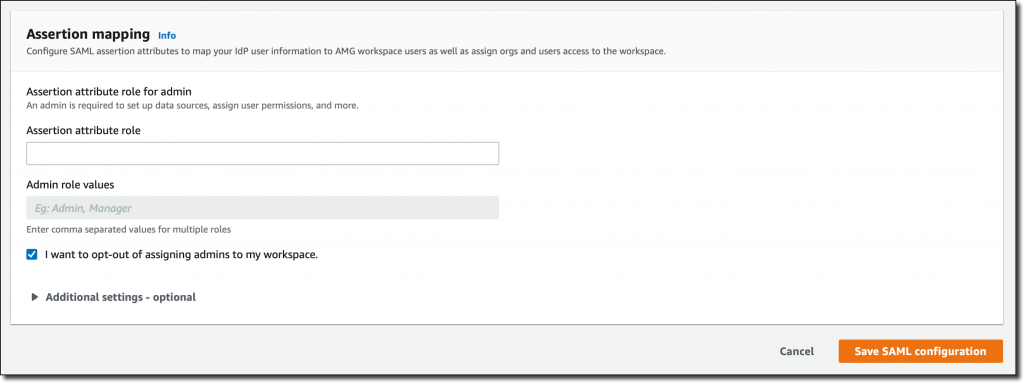
Finally, I can map user permissions in my IdP to Grafana user permissions, such as specifying which users will have Administrator, Editor, and Viewer permissions in my Amazon Managed Grafana workspace.
Availability and Pricing
Amazon Managed Grafana is available today in ten AWS Regions: US East (N. Virginia), US East (Ohio), US West (Oregon), Europe (Ireland), Europe (Frankfurt), Europe (London), Asia Pacific (Singapore), Asia Pacific (Tokyo), Asia Pacific (Sydney), and Asia Pacific (Seoul). For more information, see the AWS Regional Services List.
With Amazon Managed Grafana, you pay for the active users per workspace each month. Grafana API keys used to publish dashboards are billed as an API user license per workspace each month. You can upgrade to Grafana Enterprise to have access to enterprise plugins, support, and on-demand training directly from Grafana Labs. For more information, see the Amazon Managed Grafana pricing page.
— Danilo


