 |
In October 2020, we announced the preview of AWS Lambda extensions, which you can use to easily integrate Lambda functions with your favorite tools for monitoring, observability, security, and governance.
Today, I’m happy to announce the general availability of AWS Lambda Extensions which comes with new performance improvements and an expanded set of partners. As part of the GA release, we have enabled functions to send responses as soon as the function code is complete without waiting for the included extensions to finish. This enables extensions to perform activities like sending telemetry to a preferred destination after the function’s response has been returned. We also welcome extensions from new partners: Imperva, Instana, Sentry, Site24x7, and the AWS Distro for OpenTelemetry.
You can use Lambda extensions for use cases such as capturing diagnostic information before, during, and after function invocation; automatically instrumenting your code without needing code changes; fetching configuration settings or secrets before the function invocation; detecting and alerting on function activity through security agents; and sending telemetry to custom destinations such as Amazon Simple Storage Service (Amazon S3), Amazon Kinesis, Amazon Elasticsearch Service directly and asynchronously from your Lambda functions.
Customers are drawn to the vision of Serverless. The reduced operational responsibility frees them up to focus on their business problems. To help customers monitor, observe, secure, and govern their functions, AWS Lambda provides native integrations for logs and metrics through Amazon CloudWatch, tracing through AWS X-Ray, tracking configuration changes through AWS Config, and recording API calls through AWS CloudTrail In addition, AWS Lambda partners provide tools for application management, API integration, deployment, monitoring, and security.
AWS Lambda extensions provide a simple way to extend the Lambda execution environment, which is where your function code is executed. AWS customers, partners, and the open source community can use the new Lambda Extensions API to build their own extensions, which are companion processes that augment the capabilities of Lambda functions. To learn how to build your own extensions, see the Building Extensions for AWS Lambda – In preview blog post. The post also includes information about changes to the Lambda lifecycle.
How AWS Lambda Extensions Works
AWS Lambda extensions are designed to be the easiest way to plug in the tools you use today without complex installation or configuration management. You can add tools to your functions using Lambda layers or include them in the image for functions deployed as container images.
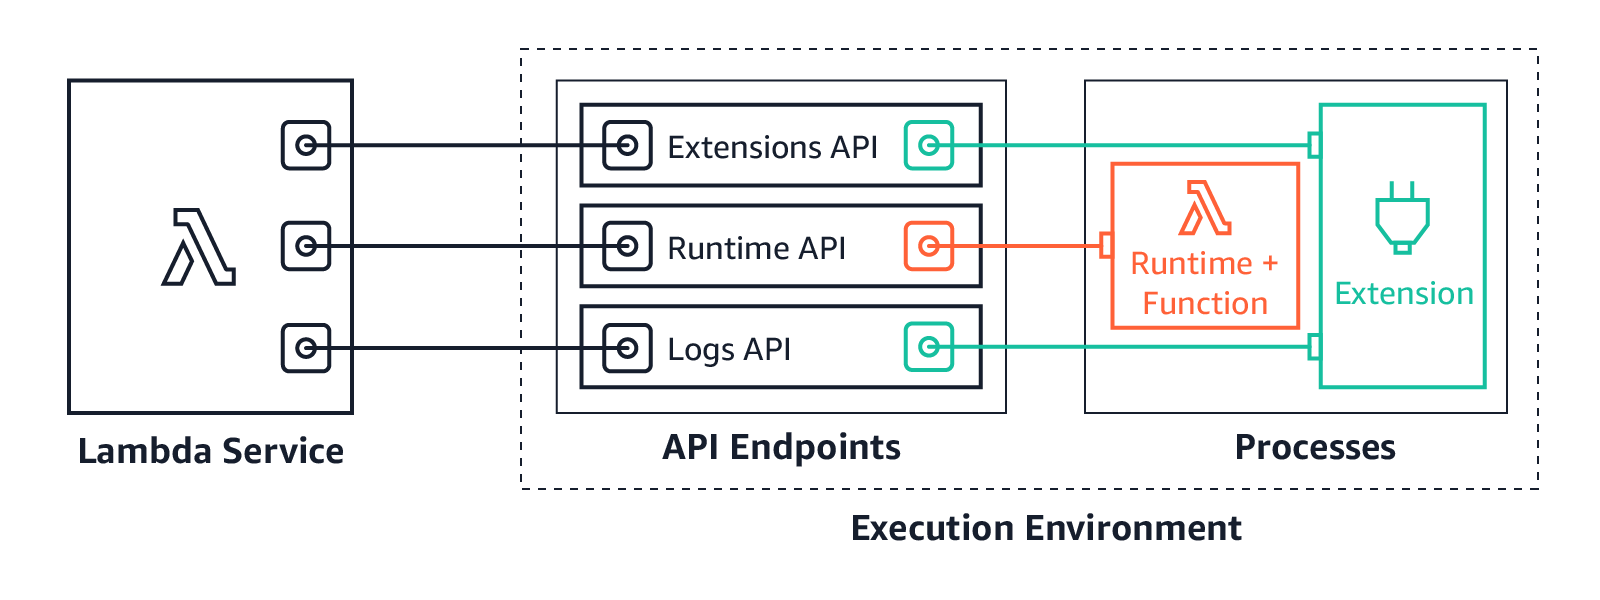
Lambda extensions use the Extensions API to register for function and execution environment lifecycle events. In response to these events, extensions can start new processes or run logic. Lambda extensions can also use the Runtime Logs API to subscribe to a stream of the same logs that the Lambda service sends to Amazon CloudWatch directly from the Lambda execution environment. Lambda streams the logs to the extension, and the extension can then process, filter, and send the logs to any preferred destination.
Most customers will use Lambda extensions without needing to know about the capabilities of the Extensions API. You can just consume capabilities of an extension by configuring the options in your Lambda functions.
How to Use Lambda Extensions
You can install and manage extensions using the Lambda console, the AWS Command Line Interface (CLI), or infrastructure as code (IaC) services and tools such as AWS CloudFormation, AWS Serverless Application Model (AWS SAM), and Terraform.
To use Lambda extensions to integrate existing tools with your Lambda functions, choose your a Lambda function and on the Configuration tab, choose Monitoring and Operations tools.
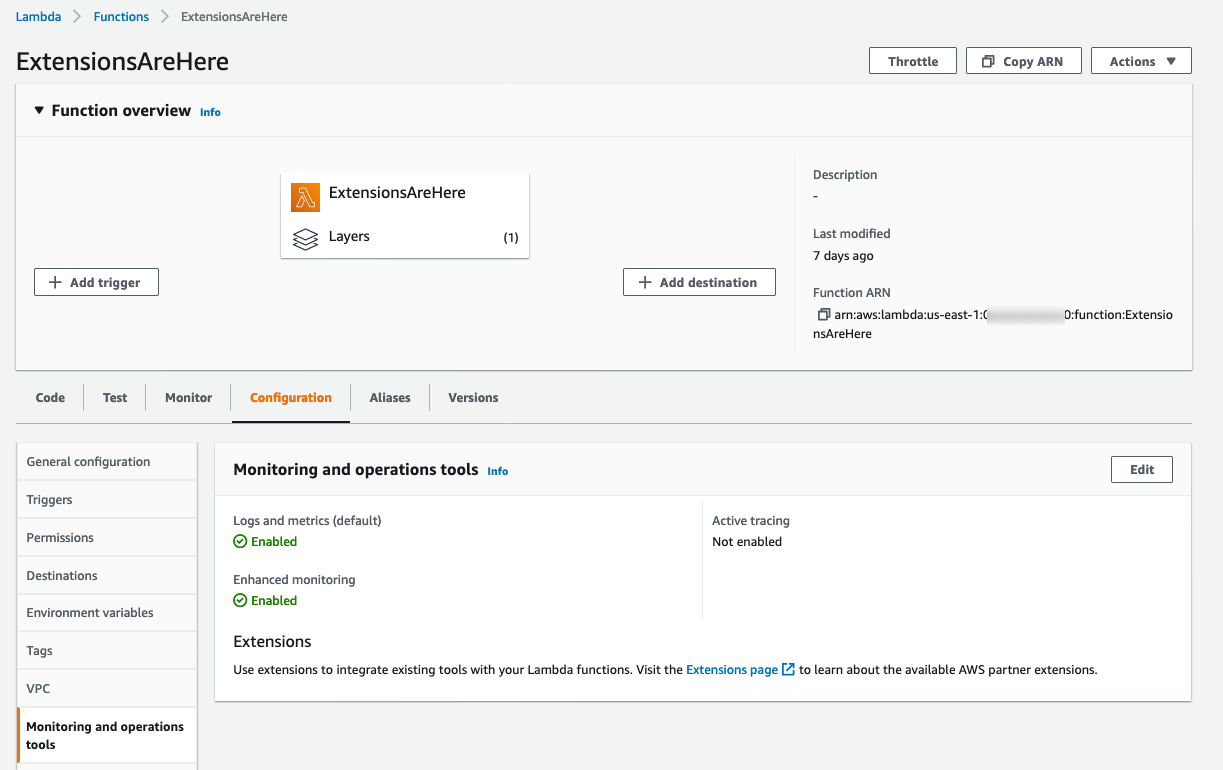
On the Extensions page, you can find available extensions from AWS Lambda partners. Choose an extension to view its installation instructions.

AWS Lambda Extensions Partners
At this launch, Lambda extensions integrate with these AWS Lambda partners who have provided the following information to introduce their extensions. (I am updating this article with links as they are published.)
- AppDynamics provides end-to-end transaction tracing for AWS Lambda. With the AppDynamics extension, it is no longer mandatory for developers to include the AppDynamics tracer as a dependency in their function code, making tracing transactions across hybrid architectures even simpler.
- Coralogix is a log analytics and cloud security platform that empowers thousands of companies to improve security and accelerate software delivery, allowing you to get deep insights without paying for the noise. Coralogix can now read Lambda function logs and metrics directly, without using CloudWatch or Amazon S3, reducing the latency, and cost of observability.
- The Datadog extension brings comprehensive, real-time visibility to your serverless applications. Combined with Datadog’s integration with AWS, you get metrics, traces, and logs to help you monitor, detect, and resolve issues at any scale. The Datadog extension makes it easier than ever to get telemetry from your serverless workloads.
- The Dynatrace extension makes it even easier to bring AWS Lambda metrics and traces into the Dynatrace platform for intelligent observability and automatic root cause detection. Get comprehensive, end-to-end observability with the flip of a switch and no code changes.
- Epsagon helps you monitor, troubleshoot, and lower the cost of your Lambda functions. Epsagon’s extension reduces the overhead of sending traces to the Epsagon service, with minimal performance impact to your function.
- HashiCorp Vault allows you to secure, store, and tightly control access to your application’s secrets and sensitive data. With the Vault extension, you can now authenticate and securely retrieve dynamic secrets before your Lambda function is invoked.
- Honeycomb is a powerful observability tool that helps you debug your entire production app stack. Honeycomb’s extension decreases the overhead, latency, and cost of sending events to the Honeycomb service, while increasing reliability.
- Instana Enterprise Observability Platform ingests performance metrics, traces requests, and profiles processes to make observability work for the enterprise. The Instana Lambda extension offers modification-free, low latency tracing of Lambda functions backed by their real-time Enterprise Observability Platform.
- Imperva Serverless Protection protects organizations from vulnerabilities created by misconfigured apps and code-level security risks in serverless computing environments. The Imperva extension enables customers to easily embed additional security in their DevOps processes for serverless applications without requiring any code changes, leading to faster time to market.
- Lumigo provides a monitoring and observability platform for serverless and microservices applications. The Lumigo extension enables the new Lumigo Lambda Profiler to see a breakdown of function resources, including CPU, memory, and network metrics. Use the extension to receive actionable insights to reduce Lambda runtime duration and cost, fix bottlenecks, and increase efficiency.
- Check Point CloudGuard provides full lifecycle security for serverless applications. The CloudGuard extension enables Function Self Protection data aggregation as an out-of-process extension, providing detection and alerting on application layer attacks.
- New Relic enables you to efficiently monitor, troubleshoot, and optimize your Lambda functions. New Relic’s extension allows you send your Lambda service platform logs directly to New Relic’s unified observability platform, allowing you to quickly visualize data with minimal latency and cost.
- Thundra provides an application debugging, observability and security platform for serverless, container and virtual machine (VM) workloads. The Thundra extension adds asynchronous telemetry reporting functionality to the Thundra agents, getting rid of network latency.
- Splunk offers an enterprise-grade cloud monitoring solution for real-time full-stack visibility at scale. The Splunk extension provides a simplified runtime-independent interface to collect high-resolution observability data with minimal overhead. Monitor, manage, and optimize the performance and cost of your serverless applications with Splunk Observability solutions.
- Sentry’s extension enables developers to monitor code health. From error tracking to performance monitoring, developers can see issues more clearly, solve them quicker, and continuously stay informed about the health of their applications, all without making code changes.
- Site24x7 provides a performance monitoring solution for DevOps and IT operations. The Site24x7 extension enables real-time observability into your Lambda functions. It enables you to monitor critical Lambda metrics and function executions logs and optimize execution time and performance.
- The Sumo Logic extension enables you to get instant visibility into the health and performance of your mission-critical applications using AWS Lambda. With this extension and Sumo Logic’s continuous intelligence platform, you can now ensure that all your Lambda functions are running as expected by analyzing function, platform, and extension logs to quickly identify and remediate errors and exceptions.
Here are Lambda extensions from AWS services:
- AWS AppConfig helps you manage, store, and safely deploy application configurations to your hosts at runtime. The AWS AppConfig extension integrates Lambda and AWS AppConfig seamlessly. Lambda functions have simple access to external configuration settings quickly and easily. Developers can now dynamically change their Lambda function’s configuration safely using robust validation features.
- Amazon CodeGuru Profiler helps developers improve application performance and reduce costs by pinpointing an application’s most expensive line of code. It provides recommendations for improving code to save money. The Lambda integration removes the need to change any code or redeploy packages.
- Amazon CloudWatch Lambda Insights enables you to efficiently monitor, troubleshoot, and optimize Lambda functions. The Lambda Insights extension simplifies the collection, visualization, and investigation of detailed compute performance metrics, errors, and logs. You can more easily isolate and correlate performance problems to optimize your Lambda environments.
- AWS Distro for OpenTelemetry is a secure, production-ready, AWS-supported distribution of the OpenTelemetry project. The Lambda extension runs the OpenTelemetry collector and enables functions to send trace data to AWS monitoring services such as AWS X-Ray and to any destination such as Honeycomb and Lightstep that supports OpenTelemetry Protocol (OTLP) using the OTLP exporter.
To get started with Lambda extensions, use the links provided to install these extensions.
Things to Know
Here are a couple of things to keep in mind:
Pricing: Extensions share the same billing model as Lambda functions and you are charged for compute time used in all phases of the Lambda lifecycle. For function invocations, you pay for requests served and the compute time used to run your code and all extensions, together, in 1ms increments. To learn more about billing for extensions, visit the Lambda FAQs page.
Performance: Lambda extensions might impact the performance of your function because they share resources such as CPU, memory, and storage with the function, and because extensions are initialized before function code. For example, if an extension performs compute-intensive operations, you might see your function’s execution duration increase because the extension and your function code share the same CPU resources.
Because Lambda uses allocates proportional CPU power based on the memory setting, you might see increased execution and initialization duration at lower memory settings as more processes compete for the same CPU resources. You can use CloudWatch metrics such as PostRuntimeExecutionDuration to measure the extra time the extension takes after the function execution and MaxMemoryUsed to measure the increase in memory used.
Available Now
The performance improvements announced as part of GA are currently in US East (N. Virginia), Europe (Ireland), and Europe (Milan) Regions.
You can also build your own extensions. To learn how to build extensions, see the Lambda Extensions API in the AWS Lambda Developer Guide. You can send feedback through the AWS forum for AWS Lambda or through your usual AWS Support contacts.
— Channy
Update. Watch a quick introductory video and a deep dive playlist about AWS Lambda Extensions for more information.